Setting Up Homepage Dashboard: Integrating Docker Containers and TrueNAS SCALE Monitoring

🇺🇦 Читати цю статтю в оригіналі українською
In previous articles, we deployed a full local infrastructure, organized our domains, and secured our traffic using SSL. Now it is time to combine all of our services (Grafana, AdGuard, Plex, Transmission, UrBackup) into a single, beautiful, modern, and informative starting page.
Today, we will dissect the configuration of the popular Homepage dashboard (by gethomepage.dev), connect it to the Docker container stats of a remote Ubuntu VM, and configure system hardware monitoring for TrueNAS SCALE via its API.
Step 1. Installing Homepage on TrueNAS SCALE
To run the dashboard, we will use the ready-made official app from the TrueNAS SCALE catalog:
- Go to Apps -> Discover Apps.
- Search for Homepage and click Install.
- Storage Settings (Important): By default, the system suggests temporary storage (
ixVolume). To prevent your configurations from disappearing whenever the app updates or restarts, under the Storage section, choose the Host Path type of storage and specify the path to a pre-created directory on your ZFS pool (e.g.,/mnt/Mega/configs/homepage). - Permissions: Ensure that the owner or a user with write permissions to this folder is the system user
apps(UID/GID568in TrueNAS SCALE). If the folder is owned byrootwith no write permissions forapps, the container won’t be able to write the default configuration files and will crash on launch. - Save and start the application.
Step 2. Connecting Docker Container Statuses
Homepage can show the CPU/RAM load and running state (RUNNING / STOPPED) for any dashboard card. Since our dashboard runs on TrueNAS SCALE and the containers are launched on a separate Ubuntu VM, we need to link them securely.
To do this, we run a lightweight Docker socket proxy on the Ubuntu VM: docker-socket-proxy:
1
2
3
4
5
6
7
8
9
10
11
12
13
# Add to docker-compose.yml on the Ubuntu VM:
services:
  docker-proxy:
    image: tecnativa/docker-socket-proxy:latest
    container_name: docker-proxy
    restart: unless-stopped
    environment:
      - CONTAINERS=1 # Allow reading container info
      - POST=0       # Restrict write requests (security!)
    ports:
      - "2375:2375"
    volumes:
      - /var/run/docker.sock:/var/run/docker.sock:ro
Configuring docker.yaml in Homepage:
Now, in your Homepage configs folder, open the docker.yaml file and define our VM (to be safe, we use its Tailscale IP to bypass KVM network isolation):
1
2
3
ubuntu-docker:
  host: 100.x.y.w # Tailscale IP of your Ubuntu server
  port: 2375      # Docker proxy port
Now, in the services.yaml file, we can add the server and container parameters to any service card:
1
2
3
4
5
    - Grafana:
        icon: grafana.png
        href: https://grafana.home.myhomelab.org
        server: ubuntu-docker
        container: grafana
Step 3. Monitoring TrueNAS SCALE Host via API
To display the CPU temperature, RAM load, and free ZFS pool space of our main storage, we will use the built-in widget.
Generating an API Key in TrueNAS:
- Log into your TrueNAS SCALE web panel.
- Click on your profile icon in the top right corner and choose API Keys.
- Generate a new key (e.g.,
homepage-key) and save it.
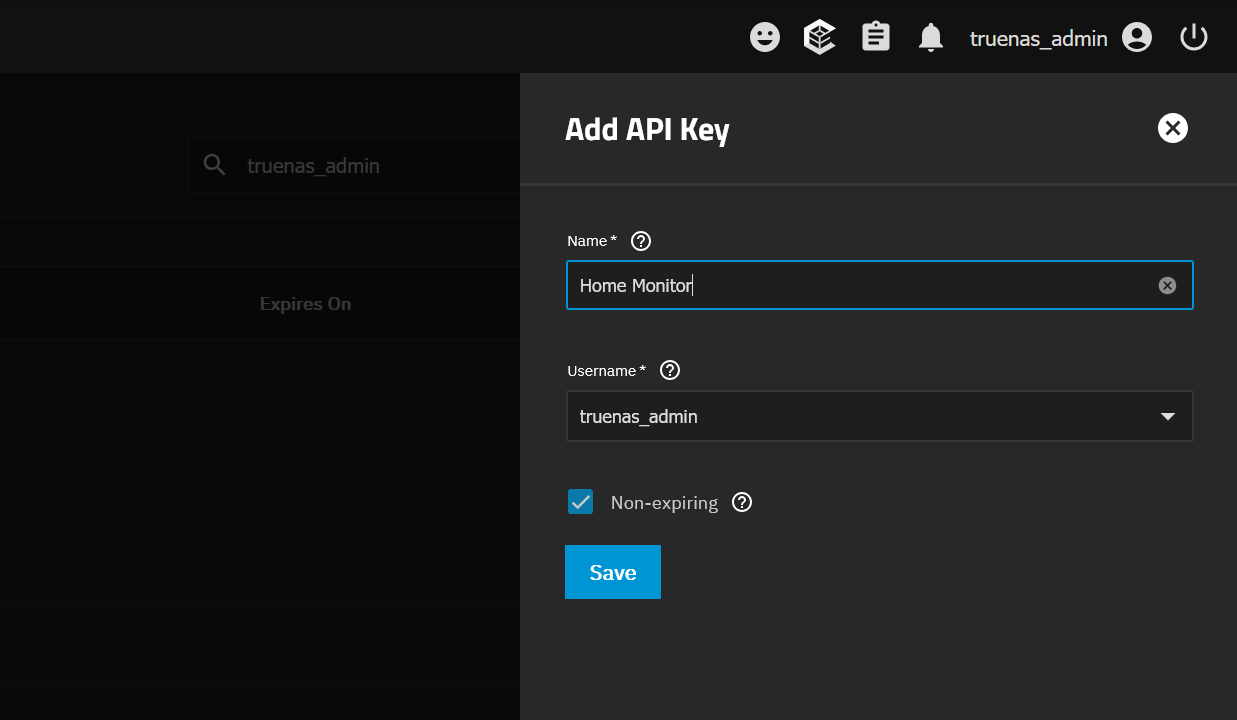 Fig. 1. Generating API Key for Homepage access
Configuring services.yaml:
Now, write the TrueNAS widget configuration in the Homepage services.yaml file:
1
2
3
4
5
6
7
8
9
- Hardware & Storage:
    - TrueNAS:
        icon: truenas.png
        href: https://truenas.home.myhomelab.org
        widget:
          type: truenas
          url: http://100.x.y.z:4434 # Tailscale IP of your TrueNAS and its web port
          key: YOUR_GENERATED_API_KEY
          enablealerts: true
Step 4. Widget Alignment and Custom Styling
By default, Homepage aligns header system widgets (clock, weather) horizontally in a single row. If you want to stack them vertically:
- Open the
custom.cssfile in your Homepage configurations directory. - Add the following CSS rules:
1
2
3
4
5
.header-widgets, div[class*="HeaderWidgets"] {
  flex-direction: column;
  align-items: flex-start;
  gap: 0.5rem;
}
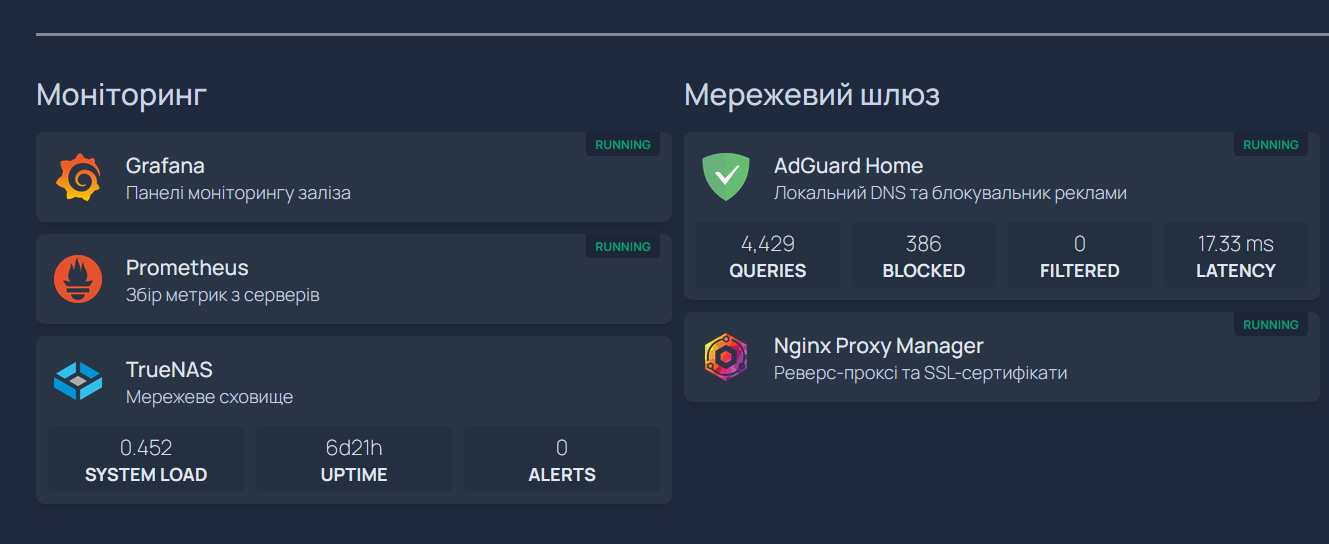 Fig. 2. Fully configured Homepage dashboard with container and service monitoring
Conclusion
The Homepage dashboard is the perfect face for a home laboratory. Thanks to smart integration with Docker and system APIs, it transforms from a simple page of bookmarks into a powerful interface for monitoring and managing your home infrastructure.