Beszel: Lightweight & Modern Server and Docker Monitoring Without the Bloat of Grafana
🇺🇦 Читайте цю статтю українською
If you manage multiple VPS instances or maintain a home lab with dozens of Docker containers, you have likely encountered the classic monitoring dilemma:
- Prometheus + Grafana + Node Exporter: The enterprise gold standard, but total overkill for home labs and lean cloud instances. The stack easily devours 500–800 MB of RAM, requires learning PromQL, and takes hours to properly configure panels.
- Netdata: Fantastic second-by-second granularity, but crowded with thousands of overwhelming charts and exerts noticeable overhead on disk and CPU.
- Uptime Kuma: An exceptional tool we covered in our previous guide, but it only answers “is the port/service alive?”—it won’t reveal which Docker container suddenly spiked server RAM to 98%.
This is why Beszel has become a breakout sensation across r/selfhosted and r/devops. It is an ultra-lightweight, blazing-fast, open-source server monitoring hub designed specifically for small-to-medium clusters, VPS setups, and homelabs.
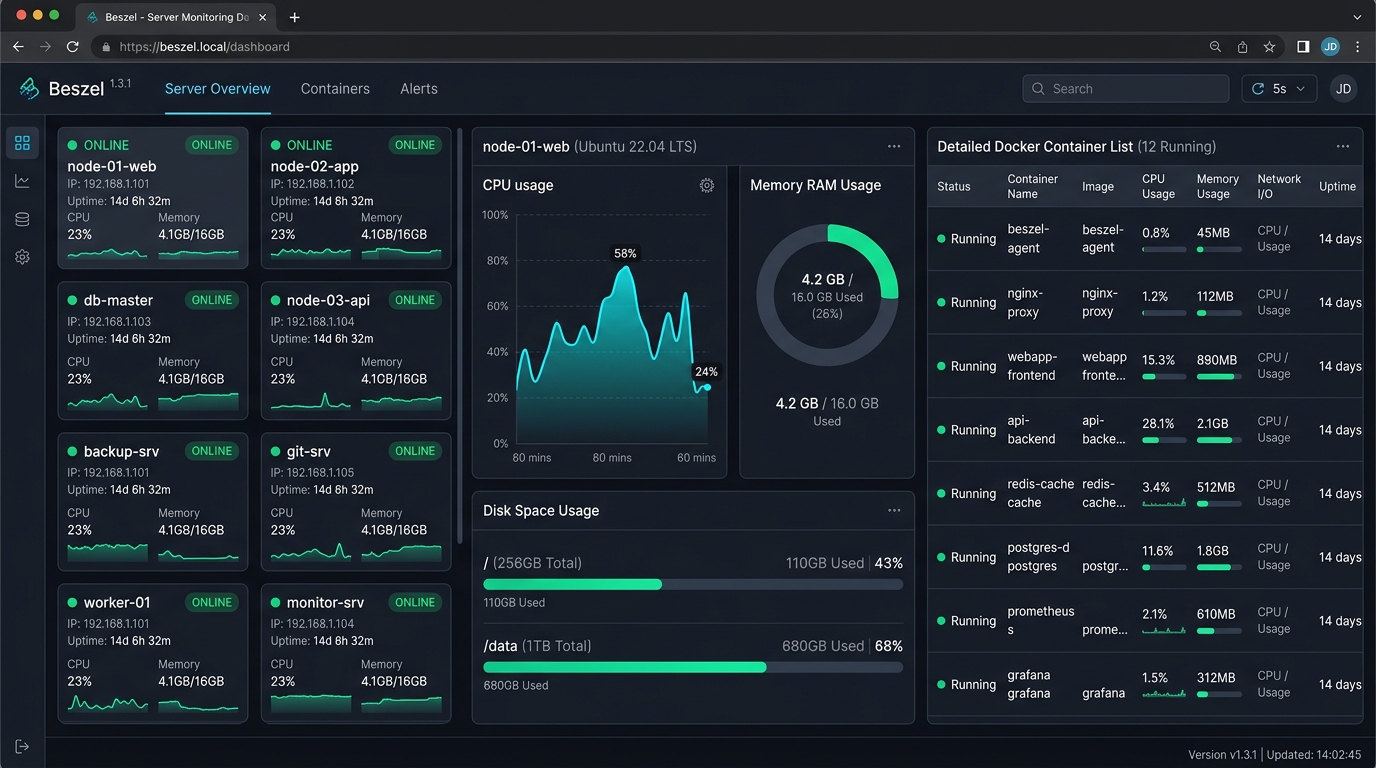 Fig 1. Beszel main dashboard: real-time host status, resource utilization charts, and container-by-container resource breakdown
Why Beszel? Core Advantages
Built in Go on top of PocketBase (for the Hub) and low-overhead system calls, Beszel approaches server observability with refreshing simplicity:
- Tiny Agent Footprint: The background agent process consumes just ~10–15 MB of RAM and virtually zero CPU.
- SSH Ed25519 Key Authentication: Communication between the central hub and remote agents is secured with cryptographic key pairs—no complex TLS certificate ceremonies or credentials required.
- Deep Docker Telemetry: Out of the box, it breaks down CPU, memory, and network utilization for every individual Docker container.
- Historical Telemetry: Stats are stored in a compact embedded SQLite database, giving you smooth historical timelines spanning hours, days, weeks, and months.
- Integrated Alerting: Built-in notifications for Telegram, Discord, Ntfy, Pushover, or Email whenever a host goes offline or thresholds are breached.
Comparison Table
| Feature | Beszel | Grafana + Prometheus | Netdata | Uptime Kuma |
|---|---|---|---|---|
| Agent Memory Footprint | ~12 MB | 100–300 MB | 80–150 MB | No Agent |
| Setup Time | 2 minutes | High (PromQL/Configs) | Low | 2 minutes |
| Docker Container Stats | Yes (Out of the box) | Requires cAdvisor | Yes | No |
| Historical Graphs | Yes | Yes | Yes | Uptime Only |
| Primary Use-Case | VPS, Homelab, Microservices | Enterprise clusters | Real-time troubleshooting | URL & Port Availability |
Architecture: How Hub & Agent Communicate
Beszel follows a clean client-server architecture:
- Beszel Hub: The central management dashboard and database. Typically installed on your primary server or homelab node.
- Beszel Agent: A minimal binary running on each monitored system (including the host running the Hub itself).
The authentication design is brilliant: the Hub generates a standard Ed25519 public key. You pass this key to the agent via an environment variable. When the Hub queries the agent on its listening port, the agent cryptographically verifies the request. Unauthenticated scrapers cannot access your server metrics.
Step 1. Deploying the Beszel Hub
Create a directory on your primary server:
1
2
mkdir -p /opt/beszel-hub
cd /opt/beszel-hub
Create docker-compose.yml:
1
2
3
4
5
6
7
8
9
10
11
services:
  beszel:
    image: henrygd/beszel:latest
    container_name: beszel-hub
    restart: unless-stopped
    ports:
      - "8090:8090"
    volumes:
      - ./beszel_data:/beszel_data
    environment:
      - PORT=8090
Start the container:
1
docker compose up -d
Verify the container is healthy:
1
docker compose ps
Open your browser at http://YOUR_SERVER_IP:8090. On first load, Beszel will prompt you to create an administrator account (email and password).
Step 2. Retrieving Your Public Key
- Log into your new Beszel admin dashboard.
- Click Add System (or the
+icon in the top header). - The modal dialog will display your generated Public Key:
1
ssh-ed25519 AAAAC3NzaC1lZDI1NTE5AAAAI...
- Copy this public key—you will pass it to the agent on each target system.
Step 3. Installing the Beszel Agent on Target Hosts
The agent can be deployed via Docker (recommended) or as a lightweight standalone systemd binary.
Option A: Via Docker Compose (Recommended)
On any server you want to monitor (including the machine hosting the Hub), create docker-compose.yml:
1
2
3
4
5
6
7
8
9
10
11
12
13
services:
  beszel-agent:
    image: henrygd/beszel-agent:latest
    container_name: beszel-agent
    restart: unless-stopped
    network_mode: host
    volumes:
      - /var/run/docker.sock:/var/run/docker.sock:ro
      # For accurate root filesystem disk usage:
      - /:/extra-filesystems/root:ro
    environment:
      PORT: 45679
      KEY: "PASTE_YOUR_PUBLIC_KEY_FROM_STEP_2"
Important Notes:
network_mode: hostis crucial so the agent can read raw network throughput from host interfaces (eth0,wg0,tailscale0) without Docker NAT distortion.- Mounting
/var/run/docker.sockin read-only mode allows the agent to extract performance stats from running containers.
Start the agent:
1
docker compose up -d
Option B: Native Binary Installation (Without Docker via systemd)
If you have a bare-metal machine or lightweight VPS without Docker:
1
2
3
curl -sL https://raw.githubusercontent.com/henrygd/beszel/main/supplemental/scripts/install-agent.sh -o install-agent.sh
chmod +x install-agent.sh
sudo ./install-agent.sh -p 45679 -k "PASTE_YOUR_PUBLIC_KEY"
The script downloads the compiled Go binary for your architecture (amd64 / arm64) and registers a managed beszel-agent.service.
Step 4. Linking the System in the Hub Dashboard
Return to your Beszel Hub web interface and fill in the system details:
- Name: A descriptive hostname (e.g.,
vps-production,truenas-storage,backup-node). - Host / IP: The IP address or domain of the monitored machine (use LAN IP, Tailscale IP, or
172.17.0.1if monitoring the local Docker host). - Port:
45679(or your custom agent port).
Click Save. Within 3–5 seconds, the status indicator will turn vibrant green (ONLINE), and telemetry will stream onto your dashboard:
- CPU core frequency and utilization.
- Memory & Swap allocations.
- Disk I/O read/write speeds and free storage.
- Network upload/download bandwidth.
- Live Docker container list with granular per-container resource metrics!
Step 5. Configuring Real-Time Alerts
A monitoring tool should actively watch your infrastructure so you don’t have to keep a dashboard open 24/7.
In Beszel, alerting is configured natively:
- Open the Alerts tab or click the bell icon on any system card.
- Select your alert provider:
- Telegram: Provide your
Bot TokenandChat ID. - Discord: Enter your Discord channel
Webhook URL. - Ntfy / Pushover / Email: Enter your server endpoints and credentials.
- Telegram: Provide your
- Set your threshold rules:
- Status: Alert if a server remains unreachable for over 1 minute.
- CPU Usage: Alert if load exceeds 85% for 10 consecutive minutes.
- Memory Usage: Alert if RAM utilization crosses 90%.
- Disk Space: Alert when disk volume capacity exceeds 85%.
Step 6. Secure Public Access via Reverse Proxy
Exposing port 8090 without TLS over the public internet is not recommended. You can easily front Beszel with a modern reverse proxy:
Caddyfile Example:
beszel.yourdomain.com {
    reverse_proxy 127.0.0.1:8090
}
Nginx Proxy Manager Setup:
Create a new Proxy Host:
- Domain Names:
beszel.yourdomain.com - Forward Hostname/IP:
172.17.0.1 - Forward Port:
8090 - Check Websockets Support and request a free Let’s Encrypt certificate under the SSL tab.
Final Thoughts & Benchmark Takeaways
After running Beszel across production VPS nodes and homelab infrastructure, going back to bloated monitoring stacks feels entirely unnecessary for typical homelab and VPS scales.
Key Takeaways:
- Instant Responsiveness: The UI renders instantly with zero lag or heavy dashboard compilation.
- Unmatched Efficiency: At ~12 MB of RAM per node, you can run the agent on minimal 512 MB or 1 GB RAM cloud droplets without worry.
- Container Clarity: Being able to instantly identify which container triggered a memory spike during automated backups is a game-changer.
If you are looking for an infrastructure monitor that sets up in 5 minutes, respects server resources, and simply works—Beszel is currently the best tool in the self-hosted ecosystem.
Deploy it on your nodes and share your experience in the comments below!